Demographics
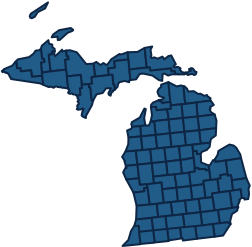
As of the 2020 Census, Montmorency County, Michigan, had a population of 9,153. The median age was 54.2 years, reflecting its older demographic. Approximately 50.2% of residents were male and 49.8% female. The racial makeup was predominantly White (96.2%), with small representations of Native American (1.1%), African American (0.3%), Asian (0.3%), and those identifying with two or more races (2.0%). Hispanic or Latino individuals comprised 1.3% of the population.
County Crime & Safety
Montmorency County, MI, maintains a relatively low crime rate compared to state and national averages. In 2022, the county reported a total of 49 criminal offenses, including 9 violent crimes and 40 property crimes, according to Michigan Incident Crime Reporting (MICR). The violent crime rate stands at approximately 1.5 per 1,000 residents, while property crime is around 6.7 per 1,000 residents. Local law enforcement collaborates with state agencies to ensure prompt reporting and community safety initiatives, contributing to the county's reputation as a safe rural area.
Elections
Montmorency County, Michigan, had 6,241 registered voters ahead of the November 2022 general election. Elections include local, state, and federal races, with polling locations in each of its 9 precincts. In 2020, 72% turnout saw Donald Trump win 72.7% of county votes versus Joe Biden’s 25.8%. Key local issues include road funding and emergency services. The county clerk administers elections. Both Republican and Democratic parties are active, though Republicans dominate registration and results. Voters may register online, by mail, or in person, and absentee ballots are available for all elections.
Education, Employment and Housing
Montmorency County, MI, has about 4 public schools, with 84% high school graduation rate but only 13.7% of adults holding a bachelor’s degree or higher. Average standardized test scores are below the Michigan state average. School safety is rated average, with minimal incidents reported yearly. Adult education options are limited, though some GED and vocational programs exist through regional partnerships. Educational programs largely focus on traditional curricula, with few advanced placement or enrichment opportunities.
As of 2022, Montmorency County, MI had an employment rate of approximately 46.5%. Major industries include health care & social assistance (17.4%), retail trade (16.5%), and manufacturing (11.9%). The most common occupation types are office & administrative support (13.7%), sales (12.1%), and management (10.8%). About 70% of workers commute outside the county for work, with an average commute time of 28.7 minutes. Most employed residents work in Montmorency County, but significant numbers commute to Otsego and Alpena Counties.
Montmorency County, MI, has a homeownership rate of around 85%, with median home values at about $143,000 in 2023. Median gross rent is approximately $700 per month. The housing market has seen steady growth, with property values increasing about 8% year-over-year. Housing types are primarily single-family homes, with some seasonal cottages, especially near the county’s lakes. Notable neighborhoods include Atlanta, Hillman, and Lewiston. Property taxes average 1.23% of home value, yielding estimated annual taxes of about $1,757 on a median-priced home. The area offers affordable rural living with access to outdoor recreation.
Popular names
- David Smith
- Amanda Klein
- Andrew Smith
- David Jones
- Tyler Smith
- Barbara Vogt
- Brian Klein
- Brittany Hancock
- Charles Banks
- Christina Ferguson
- Deborah Thompson
- Douglas Baker
- Eileen Baker
- Gerald Smith
- Jason Smith
- Jeffrey Jones
- Joan Smith
- Joyce Smith
- Lucinda Allen
- Mark Nihranz
- Michael Garner
- Neil Morrison
- Randy Smith
- Steven Smith
- Amanda Godin
- Amanda Hunt
- Amanda Olson
- Anthony Lis
- Anthony Ruggery
- Autumn Brown
- Benjamin Hubert
- Beverly Treloar
- Bobby Miller
- Brad Cordes
- Brock Baum
- Bruce Brown
- Bruce Hieber
- Cassandra Richardson
- Catherine Heney
- Chad Elowsky
- Charles Smith
- Chelsea Goodwin
- Cheryl Jorgensen
- Chris Kwapis
- Christina Barker
- Christina Campbell
- Clayton Brown
- Dale Robinson
- Dana Graber
- Danny Sisk
- Dave Hornbacher
- David Clayton
- David Johnson
- David Miller
- Deborah Schalk
- Dennis Allen
- Dennis Barstow
- Dennis Smith
- Dennis Villeneuve
- Donald Edwards
Other Counties in Michigan
- Alcona
- Alger
- Allegan
- Alpena
- Antrim
- Arenac
- Baraga
- Barry
- Bay
- Benzie
- Berrien
- Branch
- Calhoun
- Cass
- Charlevoix
- Cheboygan
- Chippewa
- Clare
- Clinton
- Crawford
- Delta
- Dickinson
- Eaton
- Emmet
- Genesee
- Gladwin
- Gogebic
- Grand Traverse
- Gratiot
- Hillsdale
- Houghton
- Huron
- Ingham
- Ionia
- Iosco
- Iron
- Isabella
- Jackson
- Kalamazoo
- Kalkaska
- Kent
- Keweenaw
- Lake
- Lapeer
- Leelanau
- Lenawee
- Livingston
- Luce
- Mackinac
- Macomb
- Manistee